Logs and debugging
The logs page will give you all the details you need to be sure that all your Spells are working fine and have detailed information if you need to investigate a bug or an error.
Enable debugging (optional)
You can enable debugging in each Spell settings.
The debugging option will store the Spell entry parameters and all connectors requests and responses if the Spell raises an error.
This option is disabled by default to avoid saving your personal data. If enabled, the data will be deleted after 14 days.
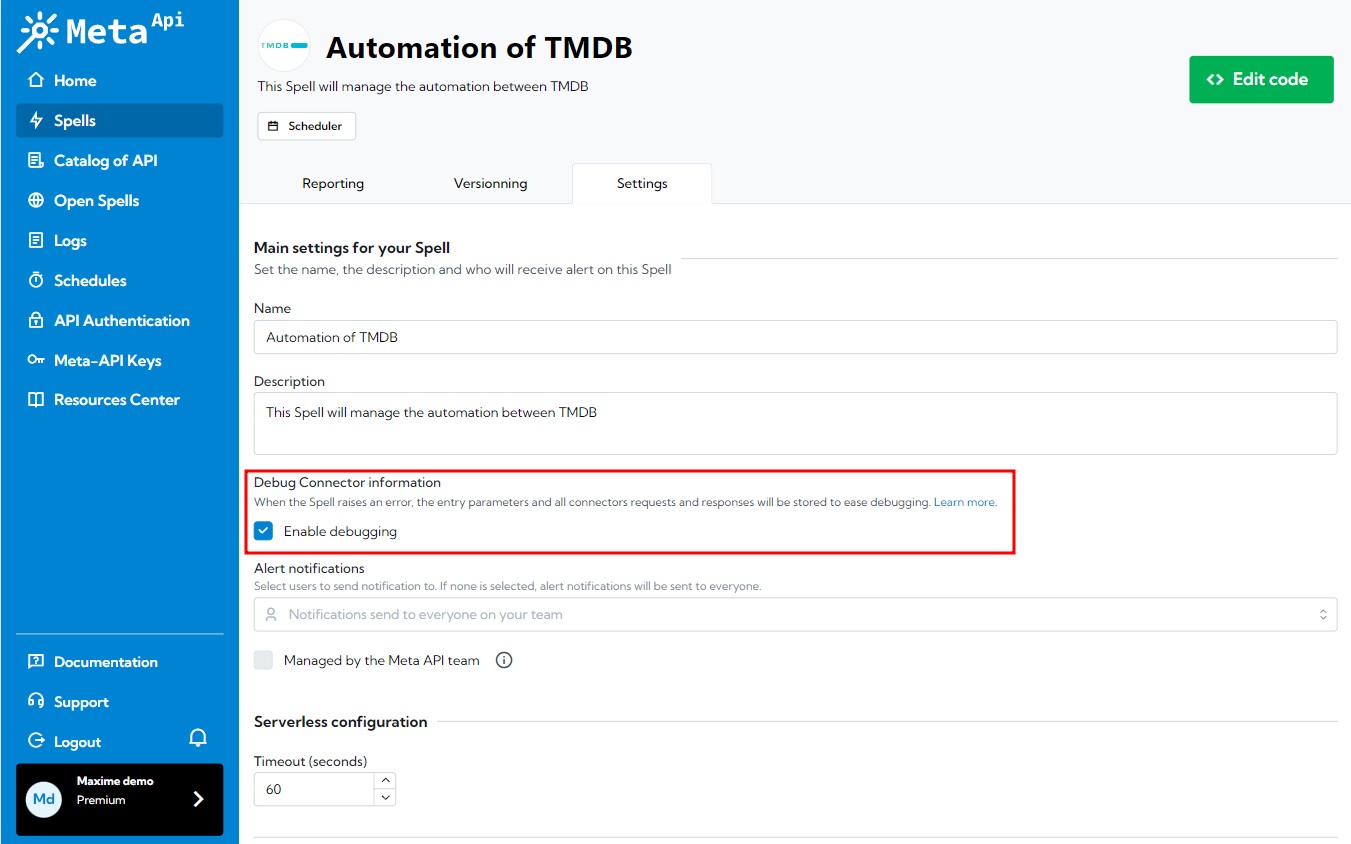
Don't forget to save.
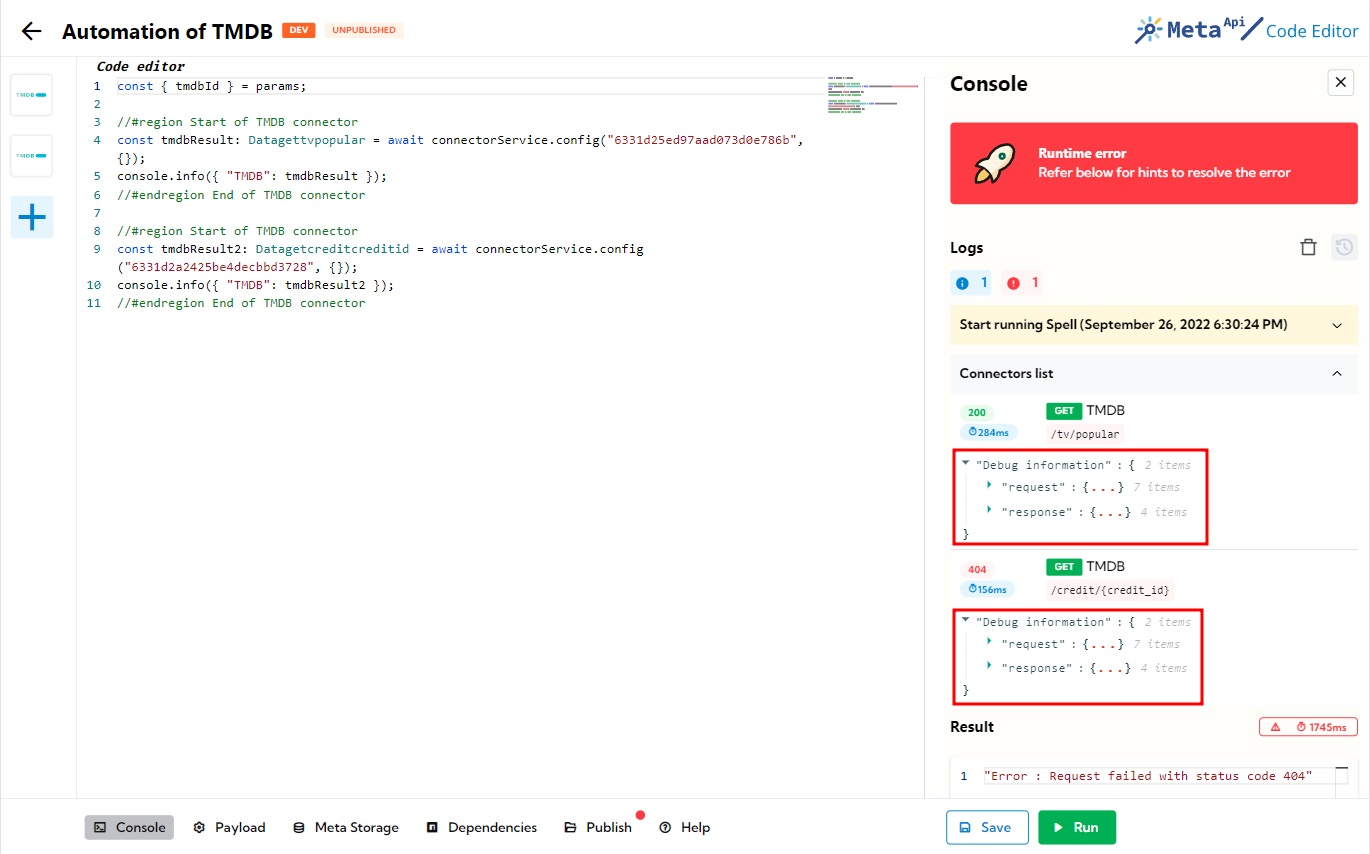
Debugging in the code editor
When the debugging option is enabled, you will have access to all connectors requests and responses, if the Spell raises an error, in the console.
Filter by Spell, date, development environment
In the log page, you have access to several filters to find the log line you need.
You can filter your logs by Spells (search box on the top of the page), by dates (the date selector), by type (success or error request) and by environment (development or production).
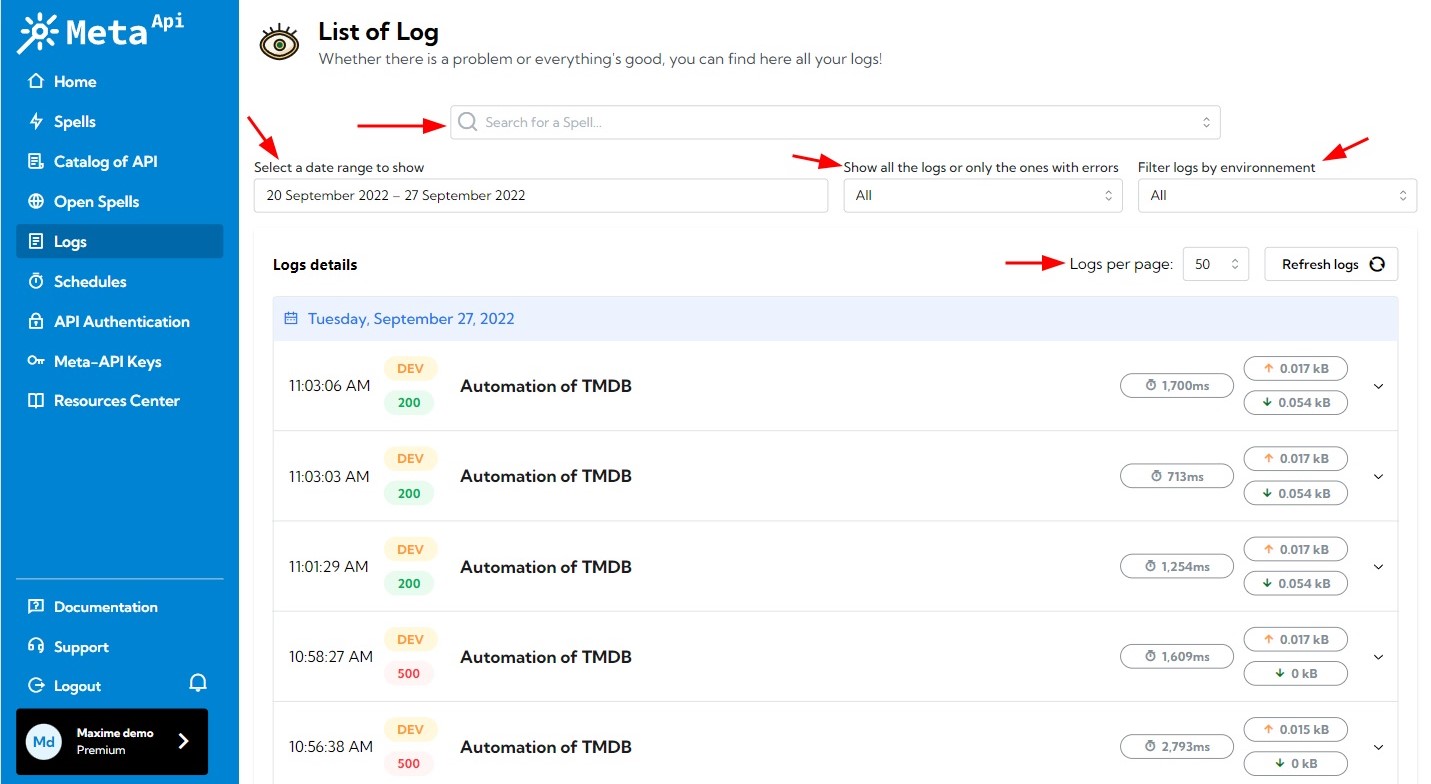
All these filters can be combined.
You can also change the number of logs you want to retrieve by change the number of logs per page.
Log details
By clicking on the arrow at the end of a log line, you will load some details about this request.
You can add some data inside a log request by using console.log() or console.error() inside your code.
If an error append on a connector or on a request, an error entry is automatically created.
Here is an example of a log entry:
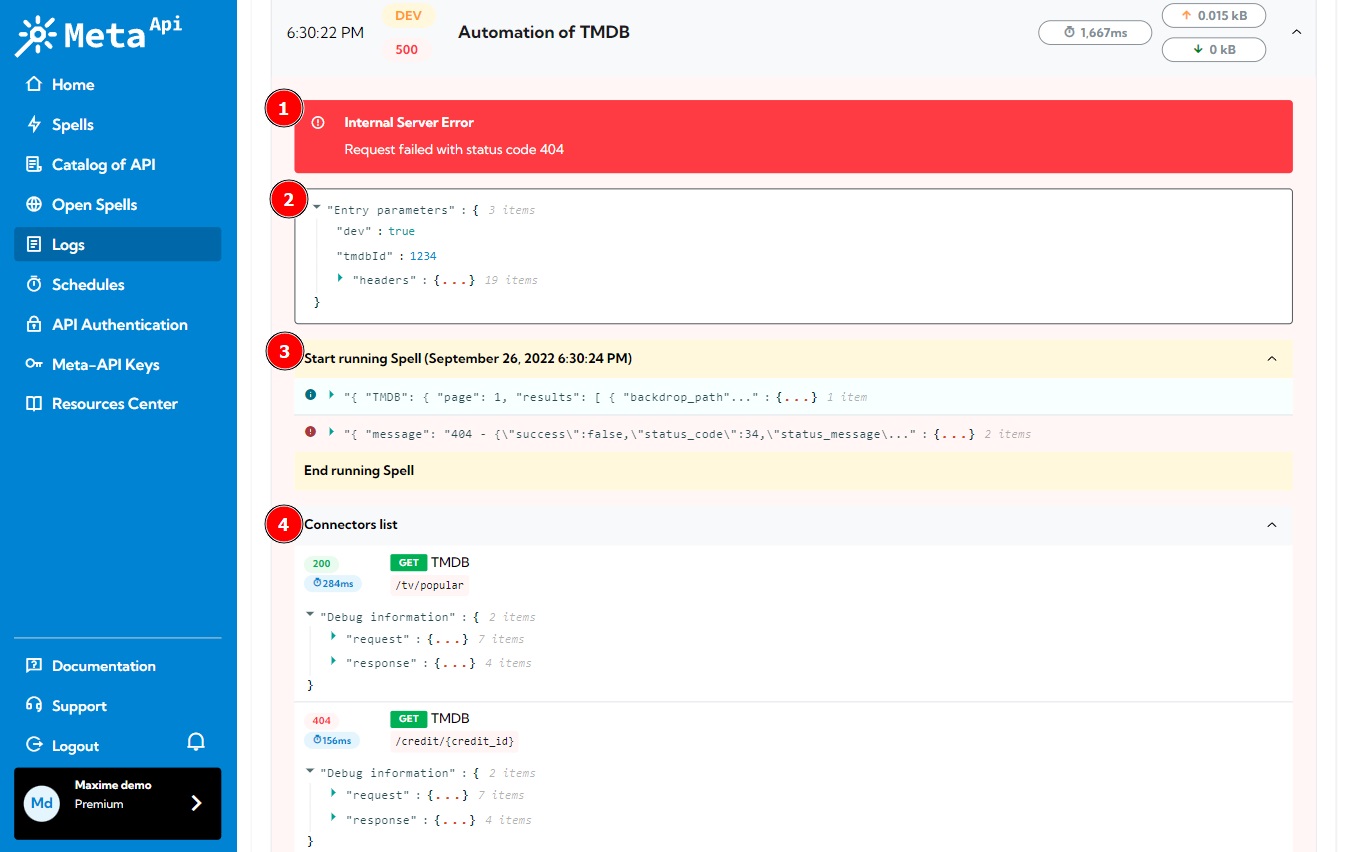
Here are some explanations:
- The main reason with this request has crashed. In our example, an HTTP 404 error is the origin of this crash.
- The Spell entry parameters (only if the debugging option is enabled and the Spell raised an error)
- The console data. We can see that we have a
console.logwith some data and aconsole.errorwhich have interrupted our Spell - Information about all connectors called (in order) inside your request with their HTTP code and latency. We can see that TMDB has been called twice. The first one, the request went fine (HTTP 200) but the second one, TMDB's API return an HTTP 404 error. We can also see the debugging information if the option is enabled and the Spell raised an error.
In our example, this crash has been caused by an HTTP 404 from TMDB's API. An HTTP 404 error imply a bad request: so it's something to correct in our code.
Check our Common development errors section in our documentation to have information on how solving HTTP errors and common errors.